defLOWRANGE(S):# LOWRANGE(LOW)表示当前最低价是近多少周期内最低价的最小值 by jqz1226rt=np.zeros(len(S))foriinrange(1,len(S)):rt[i]=np.argmin(np.flipud(S[:i]>S[i]))returnrt.astype('int')
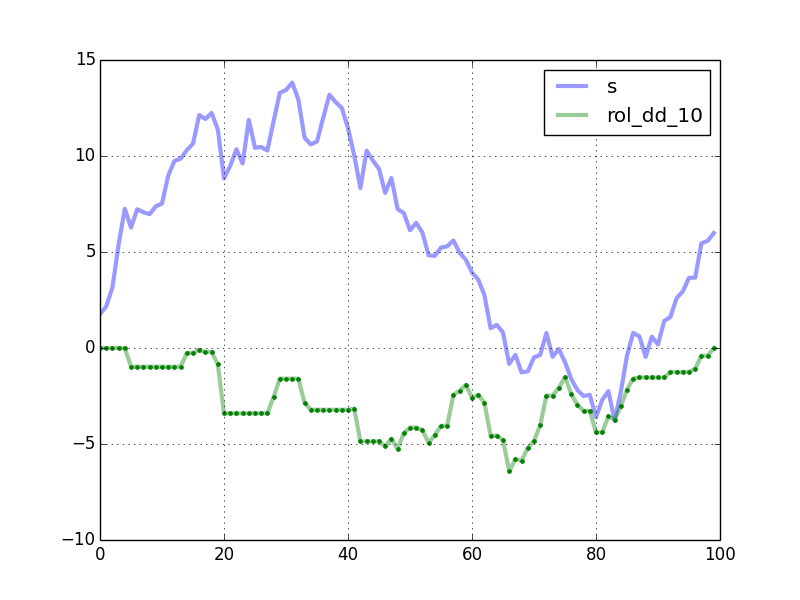
max drawdown是衡量投资策略风险的重要指标,因此,在empyrical库中有实现。不过,作为策略风险评估指标,empyrical没必要返回duration等信息,也没有实现滑动窗口下的mdd。现在,我们就来实现滑动版本。
1 2 3 4 5 6 7 8 910111213141516
# https://stackoverflow.com/a/21059308fromnumpy.lib.stride_tricksimportas_stridedimportmatplotlib.pyplotaspltdefwindowed_view(x,window_size):"""Creat a 2d windowed view of a 1d array. `x` must be a 1d numpy array. `numpy.lib.stride_tricks.as_strided` is used to create the view. The data is not copied. Example: >>> x = np.array([1, 2, 3, 4, 5, 6]) >>> windowed_view(x, 3) """
""" array([[1, 2, 3], [2, 3, 4], [3, 4, 5], [4, 5, 6]]) """y=as_strided(x,shape=(x.size-window_size+1,window_size),strides=(x.strides[0],x.strides[0]))returnydefrolling_max_dd(x,window_size,min_periods=1):"""Compute the rolling maximum drawdown of `x`. `x` must be a 1d numpy array. `min_periods` should satisfy `1 <= min_periods <= window_size`. Returns an 1d array with length `len(x) - min_periods + 1`. """ifmin_periods<window_size:pad=np.empty(window_size-min_periods)pad.fill(x[0])x=np.concatenate((pad,x))y=windowed_view(x,window_size)running_max_y=np.maximum.accumulate(y,axis=1)dd=y-running_max_yreturndd.min(axis=1)np.random.seed(0)n=100s=np.random.randn(n).cumsum()win=20mdd=rolling_max_dd(s,win,min_periods=1)plt.plot(s,'b')plt.plot(mdd,'g.')plt.show()
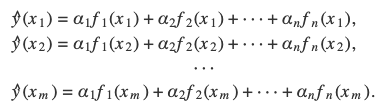
在解决天体观测所引起的误差问题时,法国人阿德里安.玛丽.勒让德(Adrien Marie Legendre)最先发现了最小二乘法(1805年),此后,高斯在1809年发表的著作《天体运动论》中也提出了这一方法。最终,他在1829年,给出了最小二乘法是线性回归最佳拟合的理论证明。这一证明被称为高斯-马尔科夫定理。
defextract_windows_vectorized(array,win:int):start=0max=len(array)-win+1sub_windows=(start+# expand_dims are used to convert a 1D array to 2D array.np.expand_dims(np.arange(win),0)+np.expand_dims(np.arange(max),0).T)returnarray[sub_windows]arr_1d=np.arange(10,20)extract_windows_vectorized(arr_1d,4)
fromnumpy.typingimportArrayLikefromtypingimportTupleimportnumpyasnpdeffind_runs(x:ArrayLike)->Tuple[np.ndarray,np.ndarray,np.ndarray]:"""Find runs of consecutive items in an array. Args: x: the sequence to find runs in Returns: A tuple of unique values, start indices, and length of runs """# ensure arrayx=np.asanyarray(x)ifx.ndim!=1:raiseValueError("only 1D array supported")n=x.shape[0]# handle empty arrayifn==0:returnnp.array([]),np.array([]),np.array([])else:# find run startsloc_run_start=np.empty(n,dtype=bool)loc_run_start[0]=Truenp.not_equal(x[:-1],x[1:],out=loc_run_start[1:])run_starts=np.nonzero(loc_run_start)[0]run_values=x[loc_run_start]# find run valuesrun_lengths=np.diff(np.append(run_starts,n))# find run lengthsreturnrun_values,run_starts,run_lengths
importnumpyasnp# NUMPY VERSION 1.24.4g=np.random.random((5000,5000))indx=np.random.randint(0,4999,(500,2))g_nan=g.copy()g_nan[indx]=np.nanmask=np.full((5000,5000),False,dtype=bool)
1234567
mask[indx]=Trueg_mask=np.ma.array(g,mask=mask)%timeit(g_mask+g_mask)**2# 901 MS ± 52.3 MS PER LOOP ...%timeit(g_nan+g_nan)**2# 109 MS ± 72.2 ΜS PER LOOP ...
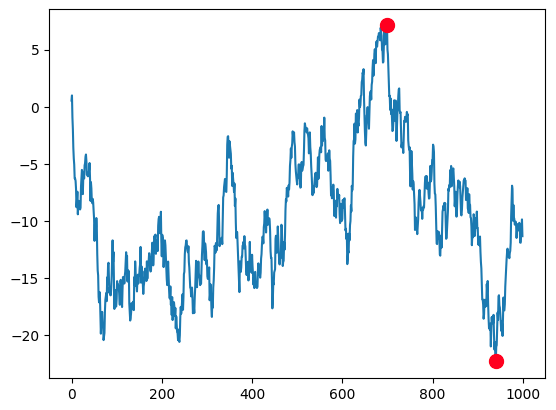
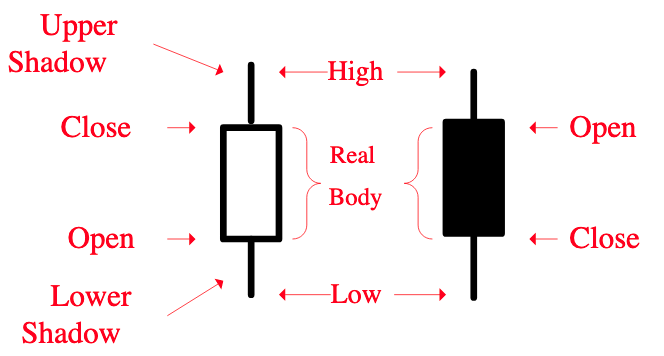
长上影线是资产向上攻击失败后留下的痕迹。它对股价后来的走势分析有一定帮助。首先,资金在这个点位发起过攻击,暴露了资金的意图。其次,攻击失败,接下来往往会有洗盘(或者溃败)。股价底部的长上影线,也被有经验的股民称为仙人指路。后面出现拉升的概率较大。上影线出现在高位时,则很可能是见顶信号。此时在较低级别的 k 线上,很可能已经出现均线拐头等比较明显的见顶信号。
data=np.array([("aaron","label")],dtype=[("name","O"),("label","O")])filter=data["name"]=="aaron"new_label="blogger"data["label"][filter]=new_label# this won't changedata[filter]["label"]=new_label
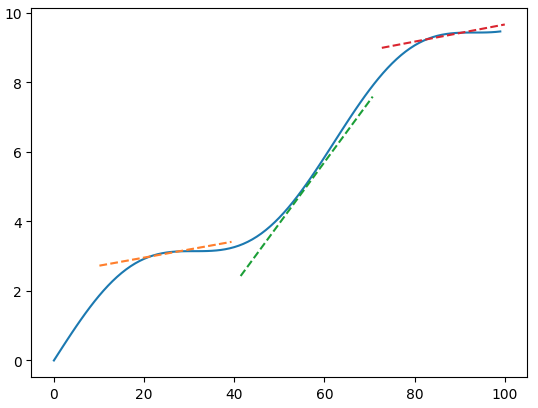
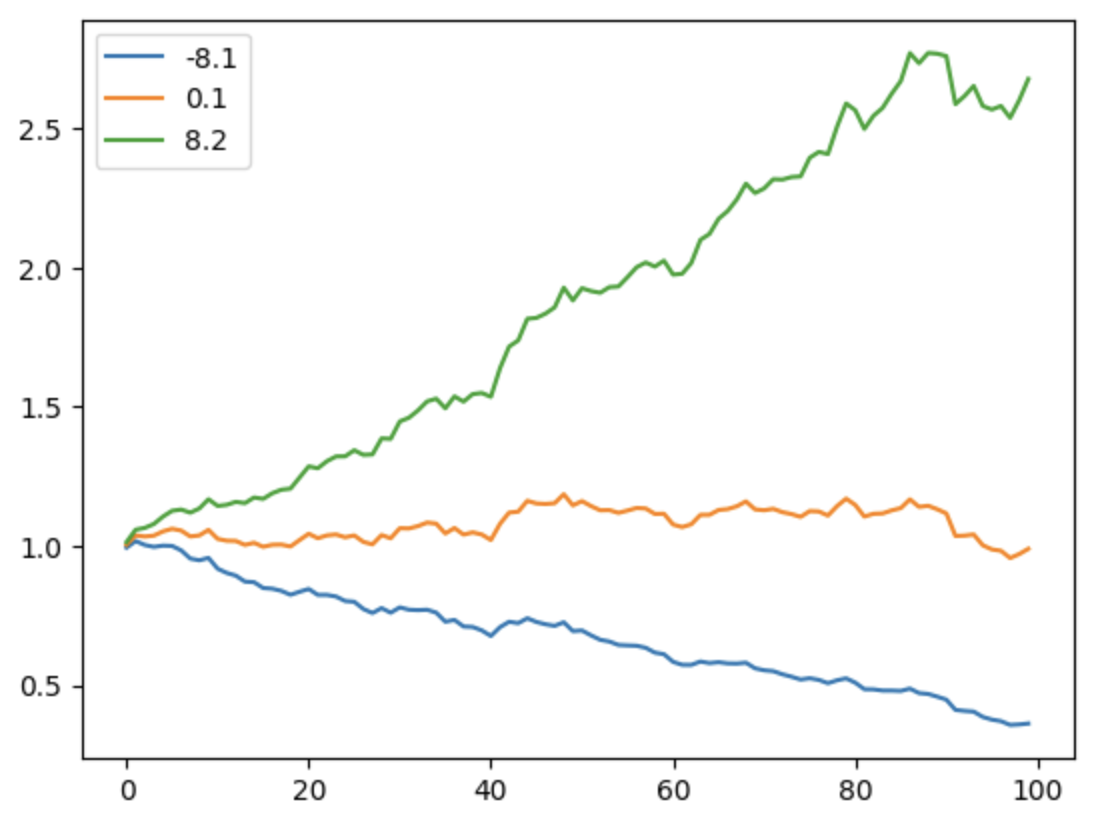
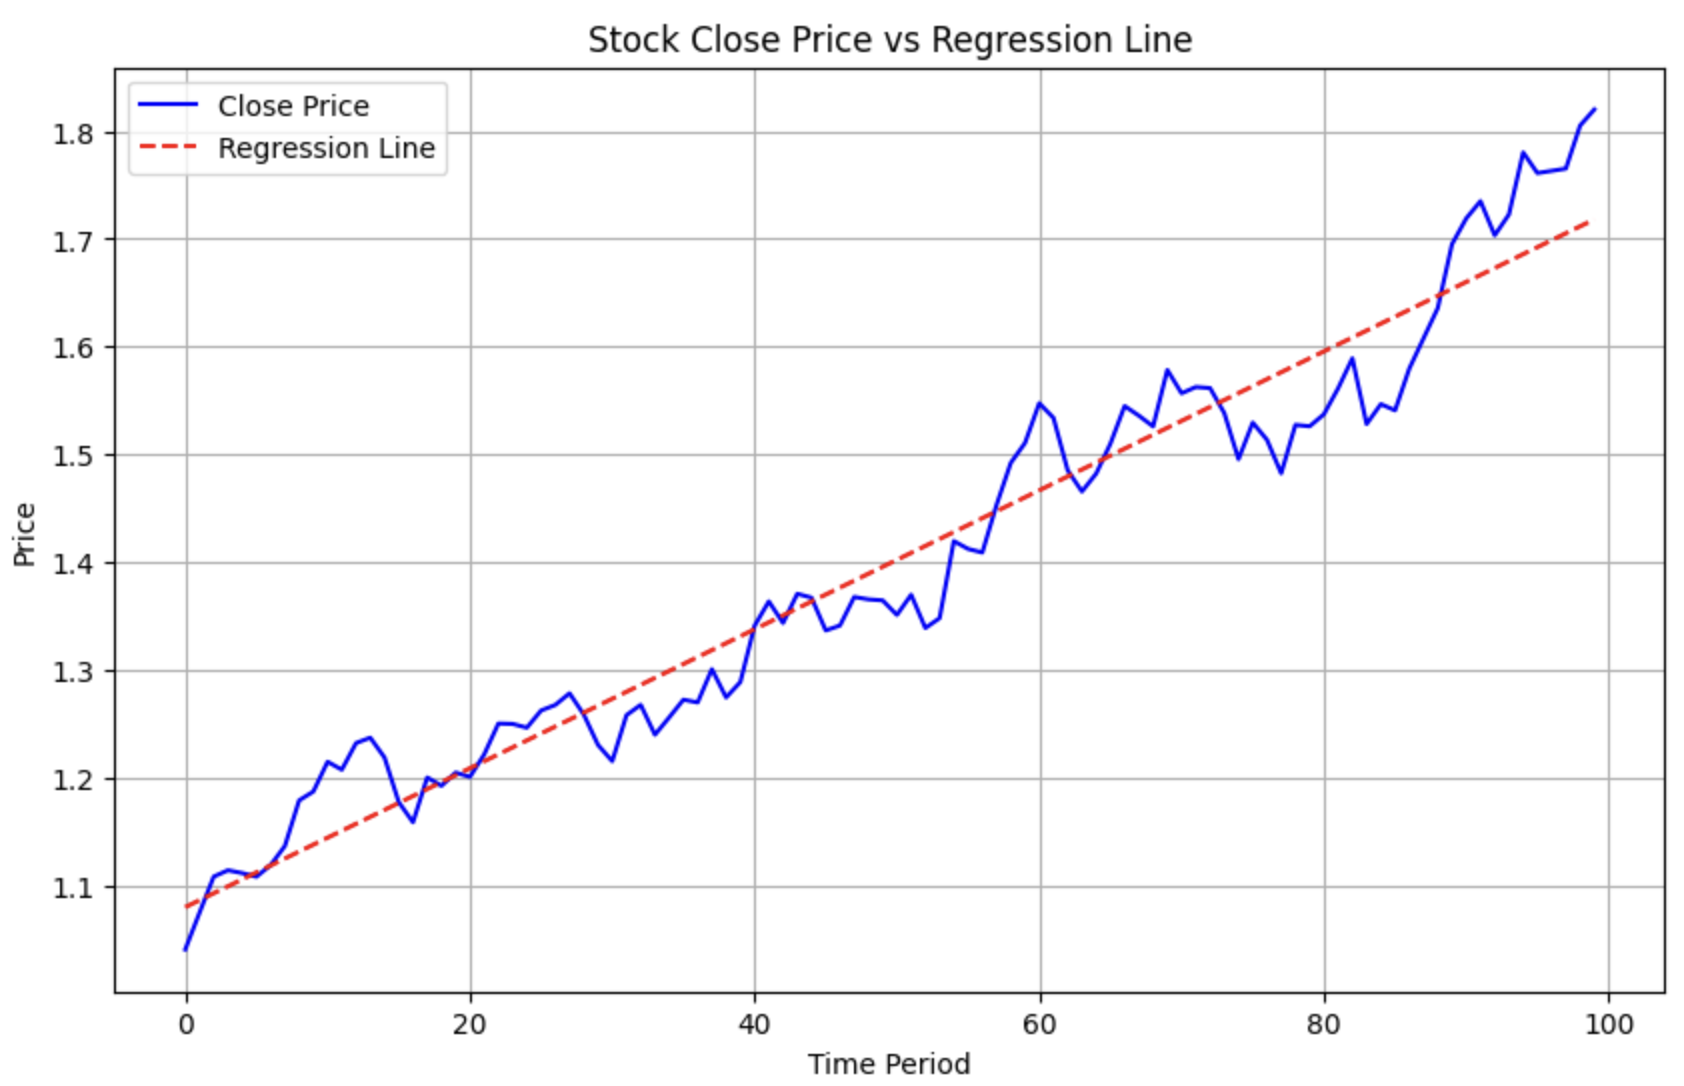
importnumpyasnpimportmatplotlib.pyplotaspltreturns=np.random.normal(0,0.02,size=100)alpha=0.01close=np.cumprod(1+returns+alpha)a,b=np.polyfit(np.arange(100),close,deg=1)# 使用 a, b 构建回归线的 y 值regression_line=a*np.arange(100)+b
1 2 3 4 5 6 7 8 910111213141516
# 绘制原始的 close 曲线plt.figure(figsize=(10,6))plt.plot(close,label='Close Price',color='blue')# 绘制回归线plt.plot(regression_line,label='Regression Line',color='red',linestyle='--')# 添加图例、标题和坐标轴标签plt.title('Stock Close Price vs Regression Line')plt.xlabel('Time Period')plt.ylabel('Price')plt.legend()# 显示图表plt.grid(True)plt.show()
arr=np.arange(6).reshape((3,2))arr=np.insert(arr.reshape((3,2)),1,-10)cprint("不指定 axis,数组被扁平化:\n{}",arr)arr=np.arange(6).reshape((3,2))arr=np.insert(arr,1,(-10,-10),axis=0)cprint("np.insert:\n{}",arr)arr=np.delete(arr,[1],axis=1)cprint("deleting col 1:\n{}",arr)
arr=np.ones((3,2))cprint("dtype is: {}",arr.dtype)cprint("shape is: {}",arr.shape)cprint("ndim is: {}",arr.ndim)cprint("size is: {}",arr.size)cprint("'len' is also available: {}",len(arr))# DTYPEdt=np.dtype('>i4')cprint("byteorder is: {}",dt.byteorder)cprint("name of the type is: {}",dt.name)cprint('is ">i4" a np.int32?: {}',dt.typeisnp.int32)
12345
# 复杂的 DTYPEcomplex=np.dtype([('name','U8'),('score','f4')])arr=np.array([('Aaron',85),('Zoe',90)],dtype=complex)cprint("A structured Array: {}",arr)cprint("Dtype of structured array: {}",arr.dtype)